Cycle Forecaster
Cycles are some of the oldest and most widely used tools in the market. Numerous techniques have been developed for the purpose of locating market cycles, and they range from mechanical devices that fit over a chart to complex computer algorithms that can take hours to calculate. The main drawback of all of these methods has to do with the fact that they focus primarily on finding the dominant cycle. In other words, what they are attempting to do is to isolate the one prominent cycle at the time that accounts for most of the market movement.
The problem with this approach is that there is never really one cycle that can move the markets by itself. The markets are in fact made up of many different cycles, all working at the same time. Sometimes the cycles will add together to create a strong rally or decline. At other times, the cycles will work against each other which will result in a choppy, trading range market. By looking for the one dominant cycle and filtering out everything else, practitioners of these cycle methods are choosing to ignore a large portion of cyclical data which can contain valuable information. If there were only one cycle operating in the markets, then price would look like a simple sine wave, oscillating up and down in predictable rhythm. This is obviously not the case, so we should not base our market analysis on this kind of false assumption.
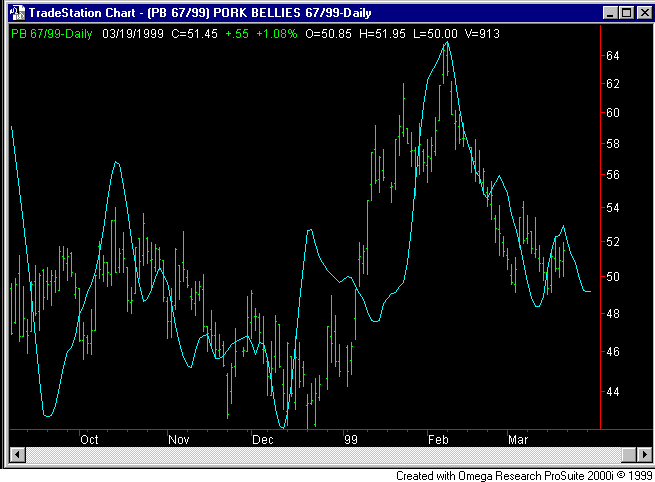
The problem then is to find a method of cycle analysis that involves the study of many cycles yet does not bog the trader down with so much information as to cause "analysis paralysis." We feel that we have one of the better solutions to this problem, and are proud to be able to offer MA_CycleForecast to the trading world. Lets take a look at a chart:

The cyan line on that chart is the output of MA_CycleForecast. Using our proprietary algorithm, it will analyze many cycles and will combine them into a single forecast for the future. You can see that the blue line extends to the right of the chart where there are no price bars. This can be done because the value of MA_CycleForecast is known ahead of time. In this case, we knew what to expect 7 bars into the future. That means that we knew about the February high a week before it occurred!
The number of bars to look into the future is a user input, so if we chose to, we could forecast the cycles further out in time. The trade off is that we would lose in accuracy what we gained in time, so it is best to try and find a balance between these two factors. We have found that a forecast window of 7 bars gives us sufficient warning to be able to take advantage of the trading opportunities while retaining enough accuracy for the forecast to be of practical value.
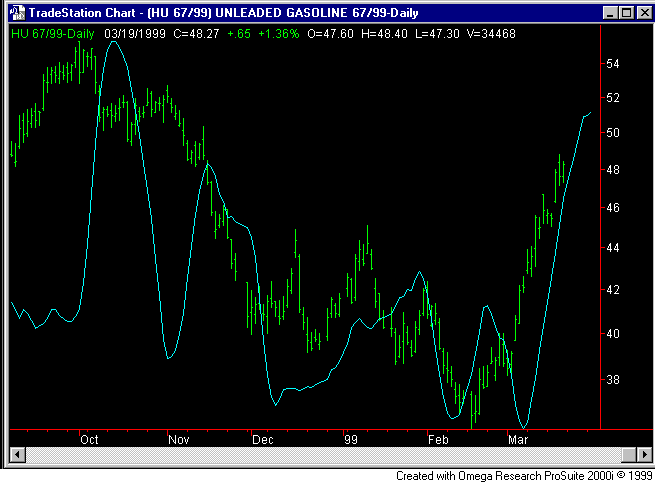
Here is a chart of Unleaded Gasoline:

You can see that explosive rallies and declines can be predicted with a startling degree of accuracy using this approach. When many cycles begin to complement and reinforce each other, a big move is likely to occur. This addition of energy is the fuel behind most of the sharp moves in the market, and MA_CycleForecast is very good at pinpointing when these moves can happen.

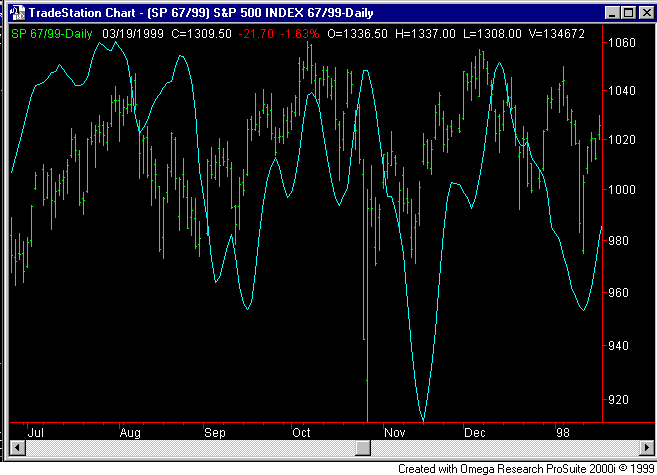
Notice that the October 1997 crash and subsequent recovery were all accurately forecast by MA_CycleForecast. Remember that the value of the cyan forecast line was known 7 days in advance, giving us plenty of time to anticipate and position ourselves for the upcoming price move.
The real power behind MA_CycleForecast is its built in self optimizing technology. Similar to MA_Predict, MA_CycleForecast uses its own error to adjust its forecast, which gives it the ability to adapt to current market conditions. Each bar, MA_CycleForecast updates and refines its forecasting method to stay in tune with the market. It is not a simple mathematical formula, but an advanced algorithm that has the ability to learn from its mistakes and to alter its settings at a moment's notice.
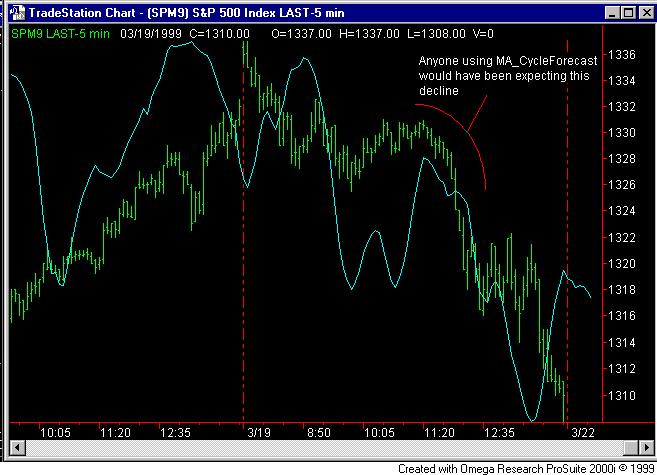
MA_CycleForecast is a universally applicable tool, which means that it can be used with equal results on any market in any time frame. Take a look at the 5 minute S&P 500 chart for 3/19/99:

Bonus Indicator!
We like to include bonus indicators with our toolkit packages, and have decided to include a very useful bonus with any purchase of MA_CycleForecast. As you can tell from its name, MA_TrailingStop is a very useful tool to use when trying to decide how or when to move a protective stop. It can also be used as a Stop and Reverse entry system, and is very good at staying on the right side of the market. Below is a chart that shows this indicator at work:

As you can see, in this case MA_TrailingStop represents a very efficient method of moving stops. It allows enough room for the market to move, but not so much as to allow too much profit to be wiped out when the trend changes.
Ordering Information
The price of MA_CycleForecast is $275. This includes the bonus indicator and unlimited support. Considering the fact that this could be one of the most effective and valuable cycle tools ever offered to the general trading community, this price is a steal. Click here for ordering information.
Note that due to the complexity of the algorithm and the necessity of plotting to the right of price, MA_CycleForecast requires TradeStation2000i or TSPro to work properly. It will not work on TradeStation 4.0 or SuperCharts 4.0. This means that if you are interested in using MA_CycleForecast in your own trading you will have to upgrade to TradeStation2000/TSPro first.